USD vs INR: How Democratic and Republican Presidents Influenced Exchange Rates
Introduction
Over the past 40 years, the Indian rupee (INR) has steadily lost value against the U.S. dollar (USD), depreciating from around ₹8 per USD in the early 1980s to over ₹80 per USD in recent years bankbazaar.com.This long-term trend reflects factors such as India’s higher inflation relative to the U.S., differing interest rates, trade imbalances, and periodic economic crises forbesindia.com.To understand the influence of U.S. political leadership on this exchange rate, it’s useful to examine how the USD/INR fluctuated under various presidencies. Key U.S. economic policies – from Reaganomics in the 1980s to pandemic-era stimulus in the 2020s – as well as economic indicators like inflation, GDP growth, and trade balances will be considered for each administration. The goal is to see if the dollar tended to strengthen or weaken against the rupee in any pattern corresponding to Republican vs. Democratic presidents, or if broader economic forces dominated.
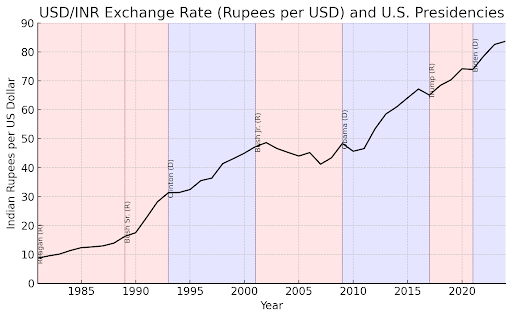
Overall Trend: The chart below shows the USD/INR exchange rate from 1981 to 2024 with U.S. presidential terms highlighted (red for Republican, blue for Democrat). The rupee’s trajectory is clearly downward (indicating a stronger USD) across all administrations, with notable steep drops around 1991 and 2013 corresponding to specific economic events fred.stlouisfed.org.Data source: Federal Reserve Economic Data (FED/RBI). This overview provides context before diving into each presidency’s details.
USD/INR exchange rate (rupees per USD), 1981–2024. Red regions denote Republican U.S. presidencies; blue denote Democratic. The rupee depreciated from ~₹8.7 in 1981 to ~₹83 by 2023 fred.stlouisfed.org with especially sharp moves during major economic events.
Reagan Administration (1981–1989)
USD/INR Trend: When Ronald Reagan took office in January 1981, $1 was about ₹8.7 fred.stlouisfed.org.By the end of his second term in 1988, $1 equaled roughly ₹14–₹16 fred.stlouisfed.org nearly double the rupee cost in eight years. This depreciation of the rupee (i.e. a stronger dollar) was partly driven by the Reagan-era “strong dollar” phenomenon in the first half of the 1980s. To combat high U.S. inflation, Federal Reserve policy (under Paul Volcker) had pushed interest rates to record levels, attracting global capital and dramatically boosting the dollar’s value. In fact, from 1980 to its peak in 1985 the U.S. dollar surged by ~50% against major world currencies atlanticcouncil.org. The rupee, which at the time was managed under a semi-pegged system, was gradually devalued from ₹7–₹8 in 1980 to over ₹12 per USD by 1985 investopedia.com fred.stlouisfed.org
Economic Policies: Reagan’s economic program – nicknamed Reaganomics – featured large income tax cuts (e.g. the 1981 tax act) and deregulation, alongside increased defense spending. The immediate effect was a stimulus to growth but also much larger fiscal deficits. The federal budget deficit rose from ~2.5% of GDP in 1981 to ~5.7% in 1983, before falling back to 2.7% by 1989 en.wikipedia.org Reagan’s policies also led to the modern era of persistent U.S. trade deficits, as domestic demand pulled in more imports paulkrugman.substack.com High U.S. interest rates and the promise of economic growth under Reagan kept the dollar strong internationally – so much so that by 1985 it was considered overvalued, hurting U.S. export competitiveness. In September 1985, the U.S. and other major nations signed the Plaza Accord to jointly weaken the dollar reuters.com After 1985, the USD’s climb finally reversed against many currencies. The rupee’s rise from ~₹12 to ~₹16 per USD over Reagan’s tenure fred.stlouisfed.org thus reflects a mix of U.S. strength early on and a controlled adjustment later. India’s own inflation (often in the 8–10% range in the 1980s) outpacing U.S. inflation (which Reagan and Volcker had slashed from 13.5% in 1980 to just 4.1% by 1988 reaganfoundation.org) also put depreciating pressure on the INR.
Key Indicators: The Reagan years saw robust U.S. growth, averaging around 3.5–4% after the 1981–82 recession, and falling inflation, as noted. By 1988, U.S. inflation was ~4% reaganfoundation.org and unemployment 5.5% (down from 7.6% in 1981) reaganfoundation.org. However, the U.S. also developed a significant trade deficit and external imbalance. This “twin deficit” scenario (federal deficit and trade deficit) introduced a large supply of dollars globally, which eventually can weaken a currency. In Reagan’s case, the dollar’s strength peaked mid-decade and then moderated. The rupee’s steady decline during the 1980s can be attributed to these factors: a mix of strong-dollar policy and high U.S. interest rates early on, and India’s own economic management (the rupee was devalued gradually by India’s central bank to maintain export competitiveness amid higher domestic inflation). Overall, under the Republican Reagan administration the USD was very strong, and the USD/INR rose significantly (indicating a weaker INR).
George H.W. Bush Administration (1989–1993)
USD/INR Trend: George H.W. Bush inherited a dollar that had come off its mid-’80s highs. At the start of 1989, $1 was about ₹16.2 fred.stlouisfed.org. By early 1993, as Bush left office, $1 was worth over ₹31 en.wikipedia.org. This nearly doubling of the exchange rate in just four years was one of the sharpest moves in the USD/INR’s history. However, it was less about U.S. policy and more about an Indian economic crisis: in 1991, India faced a severe balance-of-payments crunch and devalued the rupee drastically. In mid-1991, the Indian government cut the rupee’s value to address its foreign exchange shortage, moving from a fixed rate of around ₹17 per USD to about ₹25, and then allowed it to slide further under a new liberalized regime forbesindia.com. By 1993, after full current account convertibility was introduced, the rupee stabilized around ₹31 to the dollar en.wikipedia.org. Essentially, the Bush Sr. years coincide with India’s 1991 economic liberalization, during which the INR was intentionally weakened. The U.S. dollar’s role was more that of a stable benchmark while the rupee underwent a one-time adjustment.
Economic Policies: President Bush’s own economic policies included some continuity from Reagan (e.g. he initially favored low taxes and a strong defense), but he also confronted rising budget deficits and a mild recession in 1990–91. In 1990, Bush broke a campaign promise by agreeing to raise taxes in a deficit-reduction deal, aiming to rein in federal red ink en.wikipedia.org. The early 1990s recession, compounded by the 1990 Gulf War (which drove up oil prices), led to slower growth. The U.S. Fed had loosened monetary policy by 1990 to counter the downturn, which meant lower interest rates and some weakening of the dollar globally. Indeed, the dollar continued a gentle weakening trend against major currencies during Bush’s term – for example, it fell against the Japanese yen and German mark. But against the rupee, any dollar weakness was swamped by India’s internal crisis. In 1991, as the U.S. was coming out of recession, India was on the brink of default and had to pledge its gold reserves to stay afloat. The Bush administration did not directly intervene in USD/INR, but U.S.-led institutions (like the IMF) supported India’s reform program that included rupee devaluation.
Key Indicators: The U.S. economy under Bush Sr. was lackluster: GDP growth averaged only ~0.7% per year nasdaq.com (dragged down by the 1991 contraction), and unemployment rose to 7.3% by 1992 nasdaq.com. Inflation, however, remained moderate around 3–4% nasdaq.com, relatively low by historical standards and lower than India’s double-digit inflation at that time. The U.S. current account deficit persisted but was smaller than in the Reagan years; meanwhile, India’s current account was in acute deficit leading up to 1991. The combination of India’s high inflation and crisis-driven devaluation meant the INR weakened dramatically under Bush Sr. Thus, while the Republican Bush administration did not itself pursue a “strong dollar” mantra (Bush actually expressed concern that excessive deficits could hurt the dollar and inflation), the USD/INR rose steeply – largely due to Indian economic factors rather than partisan ones. It’s a reminder that the dollar’s strength is relative: the early ’90s saw a weak India story more than a uniquely strong U.S. story.
Bill Clinton Administration (1993–2001)
USD/INR Trend: Bill Clinton took office in January 1993, shortly after the rupee’s post-1991 adjustment. At that time $1 ≈ ₹31.3 en.wikipedia.org. By the end of Clinton’s second term in 2000, the rate was about $1 ≈ ₹46.6 en.wikipedia.org. This represents a gradual depreciation of the rupee (~50% decline over 8 years), much slower than the jump in the early ’90s. Notably, the mid-to-late 1990s were a period of broad dollar strength globally. The U.S. economy was booming and, in the words of Clinton’s Treasury Secretary Robert Rubin, the administration embraced a “strong dollar is in America’s interest” policy walton.uark.edu. This meant the U.S. generally did not intervene to weaken the dollar. The USD indeed strengthened against many currencies in the late ’90s – for example, the dollar hit multi-year highs against the yen and European currencies. The INR, however, maintained a more controlled slide: from ~₹31 in 1993 it drifted to the mid-₹30s by 1996, crossed ₹40 during the 1997–98 Asian financial crisis, and was around ₹45–46 by 2000 en.wikipedia.org. Several emerging Asian currencies collapsed much more sharply in 1997, but India avoided a crisis, allowing the rupee to depreciate in a managed fashion. Thus under Clinton (a Democrat), the U.S. dollar remained robust and the rupee’s weakening was relatively moderate and orderly compared to prior periods.
Economic Policies: Clinton’s tenure was marked by fiscal discipline and pro-growth policies. His administration enacted tax increases on higher incomes in 1993 and restrained spending growth, which, combined with strong GDP growth, turned the federal budget deficit into a surplus by the late 1990s. This fiscal improvement, along with low inflation, bolstered international confidence in the U.S. dollar. The administration consistently signaled support for a strong dollar – a stance continued by Treasury Secretaries Rubin and Lawrence Summers, who often repeated that a strong dollar benefited the U.S. walton.uark.edu. On the trade front, Clinton signed the NAFTA trade agreement and oversaw the U.S. integration into the global economy’s new WTO framework. The trade deficit did widen in the late ’90s as Americans imported more (the U.S. economy grew faster than many trading partners), but this was seen as a byproduct of growth. Meanwhile, India during the ’90s embraced economic liberalization (post-1991 reforms) which included easing foreign investment and moving toward a market-determined exchange rate. By 1994, the rupee was made partially convertible and was largely market-driven thereafter forbesindia.com. The Reserve Bank of India intervened to smooth volatility, but broadly the INR was allowed to weaken in line with inflation differentials.
Key Indicators: The late 1990s U.S. economy was very strong: GDP growth averaged ~4%, unemployment fell to 4.2% by 2001 nasdaq.com , and inflation was low around 2–3% (averaging 3.7% in Clinton’s term) nasdaq.com. The combination of high U.S. productivity (the tech boom) and fiscal surpluses made the dollar attractive. Indeed, international capital flowed into U.S. stocks and bonds, strengthening the USD. Emerging markets experienced crises (Mexico 1994, Asia 1997, Russia 1998), during which investors sought safety in dollars – another factor lifting the USD’s value. The INR did face pressure in 1997–98 when other Asian currencies plunged; the rupee dipped from ~₹35 to ₹42 per USD in that period en.wikipedia.org. India also conducted nuclear tests in 1998, briefly spurring sanctions that limited capital inflows, but the economy managed through these events. By 2000, India’s foreign reserves were healthier and the rupee’s decline remained within a controlled range. In summary, under Democratic leadership (Clinton), the U.S. dollar was strong globally thanks to robust U.S. fundamentals. The USD/INR rose, but at a moderate pace, suggesting that India’s improving economic management helped temper the rupee’s decline even as the dollar gained. There isn’t clear evidence that Clinton’s party affiliation per se caused any particular strength/weakness – rather, sound economic policy coincided with a strong dollar period.
George W. Bush Administration (2001–2009)
USD/INR Trend: George W. Bush’s presidency saw the USD/INR come full circle. In January 2001, $1 ≈ ₹47.2 fred.stlouisfed.org. By January 2009, $1 ≈ ₹48.3 fred.stlouisfed.org – almost the same level, suggesting little net change. But this masks significant fluctuations during Bush’s two terms. In the early 2000s, the U.S. dollar weakened globally. After 2002, large U.S. budget and trade deficits and low interest rates led investors to move funds into emerging markets. The rupee strengthened markedly from ~₹49 in 2002 to just ₹41 by 2007 fred.stlouisfed.org – meaning the USD bought fewer rupees, a rare phase of INR appreciation. Indeed, 2007 was a high-water mark for the INR (₹39–₹41 per USD), boosted by India’s rapid growth (~9% GDP growth) and strong capital inflows, while the U.S. dollar slumped against most currencies (the mid-2000s “twin deficits” era). However, this reversed with the 2008 global financial crisis. As the crisis hit, investors rushed to the safety of the dollar, and the U.S. Fed slashed rates while uncertainty soared. The rupee was one of many emerging currencies to fall sharply – by late 2008 it plunged back to around ₹50 per USD en.wikipedia.org. So, during Bush’s Republican administration the USD/INR first fell (USD weakened, INR strengthened) then rose back. In effect, the rupee was roughly as weak in 2009 as it was in 2001, but it experienced a strong phase in between. This illustrates how global economic cycles often outweighed partisan effects on the exchange rate.
Economic Policies: President Bush implemented sweeping tax cuts in 2001 and 2003, significantly reducing tax rates and aiming to spur investment. He also oversaw a big increase in federal spending, notably on the Afghanistan and Iraq wars and a new Medicare drug benefit. The result was a return to large fiscal deficits: the U.S. went from a budget surplus in 2000 to a deficit that reached nearly $500 billion (over 3% of GDP) by 2004. Concurrently, the U.S. current account (trade) deficit hit record levels – peaking at about $800 billion in 2006 wita.org, the highest ever. According to trade data, 2006 saw the historic peak U.S. current account deficit of $816.6 billion wita.org, reflecting huge import consumption (oil, consumer goods from China, etc.). These twin deficits generally put downward pressure on the dollar. And indeed, during 2002–2007, the dollar index fell and the Euro, pound, and emerging market currencies rose against USD. The Bush administration’s stance on the dollar was nominally the same “strong dollar” line, but in practice officials were not unhappy to see a weaker dollar aiding U.S. exporters. On monetary policy, the Fed (led by Alan Greenspan and then Ben Bernanke) cut rates aggressively in 2001–2003 to fight a recession and then raised them in 2004–2006. Low U.S. interest rates in the early 2000s had fueled carry-trades and investment into higher-yielding markets like India, thus strengthening the INR. By mid-2000s, as the Fed tightened, some of that flow moderated. But the big turning point was the 2008 financial crisis – the Bush administration supported massive interventions (bank bailouts, emergency stimulus) as the Fed slashed rates to zero. This environment caused a global dollar shortage (investors needed dollars to cover losses), paradoxically strengthening the USD at the height of the crisis.
Key Indicators: Bush’s tenure was bifurcated economically. The early 2000s saw a mild recession in 2001, then a housing and credit boom mid-decade. GDP growth averaged about 2.5% until the crisis, but the 2008 collapse brought the average down to around -1.2% per year over 2001–09 (due to the sharp 2008–09 contraction) nasdaq.com. Unemployment spiked to 7.8% by January 2009 nasdaq.com. Inflation was unusual: energy prices rose in the mid-2000s, but by the end of Bush’s term the U.S. experienced near-zero inflation (indeed the Nasdaq data shows effectively 0.0% average inflation for 2001–09 nasdaq.com, reflecting how prices soared then crashed). India during this period had higher inflation (often 5–7%) and a growing economy, which normally would weaken the INR gradually. However, India also became a favorite destination for foreign investors, offsetting inflation effects for a time. Trade balance: U.S. deficits meant the world was flooded with dollars that had to be invested; India’s increasing exports and outsourcing earnings also supplied USD to India. By late 2007, India’s reserves were large and the rupee hit its strongest in decades fred.stlouisfed.org. The subsequent U.S. financial meltdown reversed these flows – India saw capital exit in 2008, foreign investors pulled money (seeking safety in U.S. assets), and the rupee plunged ~20% in a year en.wikipedia.org. In summary, under Republican George W. Bush, the USD/INR experienced both notable dollar weakness (mid-2000s) and dollar strength (2008 crisis). No simple partisan pattern emerges: the dollar’s value was driven by deficit-fueled weakness for much of his terms, then by safe-haven strength in crisis. The net effect on USD/INR was a rough wash, highlighting that global economic cycles had a stronger impact than the president’s party.
Barack Obama Administration (2009–2017)
USD/INR Trend: Barack Obama, a Democrat, entered office in January 2009 during a global recession. $1 was around ₹48.3 at the start of 2009 fred.stlouisfed.org. By January 2017, $1 was about ₹65.1 fred.stlouisfed.org. The rupee thus depreciated ~35% over Obama’s two terms. This period saw considerable volatility for the INR. In Obama’s first term, the U.S. Federal Reserve’s quantitative easing (QE) and near-zero rates actually weakened the dollar from 2009 to 2011, contributing to capital flows into emerging markets. The INR initially remained stable in the ₹45–50 range through around 2011 en.wikipedia.org. However, by 2012–2013, cracks showed: India’s high inflation and deficits led to the “taper tantrum” in 2013. When the Fed signaled it might reduce its QE bond-buying, investors pulled out of emerging markets. In 2013 the rupee plunged to record lows, falling about 15% and breaching ₹65 per USD reuters.com. In August 2013 it hit an all-time intraday low near ₹68.85 finance.yahoo.com. This was Asia’s worst currency performance that year reuters.com, reflecting both a strong USD and India’s vulnerabilities (high current account deficit at ~4.8% of GDP in 2012). The Reserve Bank of India had to intervene and the government took measures to curb the drop. By mid-2014, the rupee recovered somewhat (helped by falling global oil prices and a new government in India elected on reform promises). In Obama’s second term (2013–2016), the USD surged globally again, as the U.S. economy picked up and the Fed started raising rates (late 2015). The rupee stabilized in the mid-₹60s, ending around ₹64–₹67 per USD in 2016 en.wikipedia.org. So under Obama, the dollar strengthened overall against INR, with the most dramatic move being the 2013 rupee crisis.
Economic Policies: Obama’s administration focused on rescuing and rebuilding the U.S. economy after the Great Recession. Early on, in 2009, a massive fiscal stimulus (American Recovery and Reinvestment Act) injected about $800 billion via spending and tax cuts. The government also bailed out auto companies and implemented financial reforms (Dodd-Frank Act) to stabilize the system. These actions, combined with the Fed’s ultra-loose monetary policy (QE programs in 2009–2013), aimed to spur growth. A side effect of QE was an increase in global dollar liquidity – some of which flowed to higher-yield economies like India, putting downward pressure on USD/INR initially. However, as the U.S. recovery gained traction, the Fed’s anticipated tightening made the dollar attractive again. By 2013, merely the announcement of potential Fed tightening (tapering) caused a dollar rally and capital flight from India reuters.com. Obama’s later years also saw fiscal tightening (the U.S. budget deficit fell from ~9% of GDP in 2009 to 3% by 2015), which in theory supports a stronger dollar by limiting supply. The administration did not explicitly manipulate the dollar; like predecessors, it officially supported a strong dollar policy. On trade, the Obama years did not see much improvement in the U.S. trade deficit – it fluctuated but remained significant ($400–500 billion annually). Meanwhile, India’s economic policy in this period included tackling inflation (the RBI adopted inflation targeting in 2014) and reducing its deficits after the 2013 scare. Those Indian reforms likely prevented further rupee free-fall.
Key Indicators: The U.S. economy under Obama had a slow but steady recovery. From 2009 to 2016, real GDP growth averaged about 1.0% per year (the average is low due to the starting contraction, but from 2010 onward growth was around 2–2.5% annually) nasdaq.com. Unemployment fell from 9–10% in 2009 to 4.7% by January 2017 nasdaq.com, a significant improvement. Inflation was quite low, averaging ~2.5% nasdaq.com, and even dipping below 1% in some years (2015 saw very low inflation due to cheap oil). Low U.S. inflation and the Fed’s eventual rate hikes made the real return on dollar assets attractive by 2015–2016. For India, the early Obama years saw high inflation (~9–10% in 2009–2011) which eroded the rupee’s purchasing power, then a decline to ~4–5% inflation by 2016 after aggressive monetary tightening. The differential inflation meant the rupee needed to depreciate over time. In 2013, India’s weak fundamentals (high inflation, high current account deficit) met a shifting U.S. monetary stance, and the result was a sharp INR depreciation – highlighting that the Federal Reserve’s actions (though independent of the presidency) can have a huge impact on exchange rates. By the end of Obama’s term, the dollar was strong internationally – the U.S. Dollar Index in 2016 was near its highest in 14 years. Thus, under a Democratic president, the dollar again showed strength and the INR weakened considerably. Correlation to party? It appears global forces (the post-crisis cycle) were dominant; however, one could note that expansionary policies in 2009–2012 coincided with a softer dollar, whereas a pivot to tighter policy coincided with a stronger dollar – aligning with the idea that Democrats’ looser policies might weaken the dollar initially, but in this case the effect was temporary walton.uark.edu. Overall, Obama’s tenure reinforced that the USD/INR is driven by macroeconomic conditions more than the president’s party, as the rupee fell under both loose and tighter U.S. policy phases.
Donald Trump Administration (2017–2021)
USD/INR Trend: Donald Trump’s presidency began with $1 ≈ ₹65.1 in Jan 2017 fred.stlouisfed.org. By Jan 2021, $1 ≈ ₹73.9 fred.stlouisfed.org. The rupee depreciated about 13% over the four years. The path, however, was not smooth: in 2018, the rupee hit new lows beyond ₹70 per USD for the first time ever, and by 2020 it briefly touched ₹75–₹76. Under Trump (a Republican), the dollar saw mixed forces. In 2017, the USD actually weakened globally despite robust U.S. growth – partly because the euro rebounded that year. But in 2018, U.S. interest rates rose (the Fed hiked multiple times) and concerns over Trump’s trade war with China and other countries led to risk aversion in markets. Many emerging market currencies slid in 2018, and the INR was no exception: it fell ~9% that year, crossing ₹70 and reaching around ₹74 by October 2018 english.alarabiya.net. Higher oil prices in 2018 (India imports most of its oil) and a widening Indian current account deficit contributed as well. Entering 2019, the rupee stabilized in the low ₹70s. In 2020, the COVID-19 pandemic caused a brief global dollar shortage in March 2020 – the rupee slid to a record low near ₹76 in April 2020. However, swift Fed action (rate cuts to zero and huge liquidity injection) and U.S. fiscal stimulus tempered the dollar’s rise. By the end of 2020, the USD had actually weakened a bit on a broad basis (as markets anticipated recovery and low U.S. rates), and the rupee recovered to ~₹73. Thus, over Trump’s term the dollar was generally strong enough to push the rupee to all-time lows, but not a dramatic outlier compared to the existing trend. The INR’s value continued to erode gradually, consistent with its inflation differential and the occasional global shocks.
Economic Policies: The Trump administration’s hallmark economic policy was the Tax Cuts and Jobs Act of 2017, a large tax reform that cut corporate tax rates from 35% to 21% and lowered individual taxes for many. This gave a short-term boost to U.S. growth in 2018 (around 3% GDP growth) and contributed to widening budget deficits (the deficit exceeded $1 trillion by 2019, ~5% of GDP). Normally, higher deficits might weaken a currency, but at the same time the Fed was tightening monetary policy in 2017–2018, which supported the dollar. Trump also launched a trade war – imposing tariffs on China and other trading partners – aiming to reduce U.S. trade deficits. In practice, the trade deficit persisted (the U.S. trade gap was $577 billion in 2019, similar to 2016 levels) and even hit a record high in 2020 as imports recovered faster than exports wita.org. The trade war did create uncertainty, leading some investors to prefer U.S. assets (paradoxically strengthening the USD as a safe haven when global growth prospects dimmed). Trump often publicly complained that a too-strong dollar hurt U.S. exports, breaking from the traditional “strong dollar” rhetoric. In 2019 he even mused about the Fed needing to weaken the dollar, but no direct intervention occurred. On the monetary side, the Fed, after raising rates in 2018, reversed course in 2019 with a few rate cuts due to slowing growth and trade uncertainty. Then came 2020: faced with the pandemic, the U.S. enacted enormous stimulus (over $3 trillion in relief bills) and the Fed flooded markets with dollars. Initially, during the market panic, the USD spiked (as global investors and companies scrambled for dollar liquidity), pressuring the rupee. But subsequent Fed actions stabilized markets. By mid-2020, interest rate differentials actually moved against the dollar (U.S. rates were now zero, while India’s were ~4%); yet the rupee didn’t rally much because the economic damage and risk aversion lingered.
Key Indicators: Before COVID-19, the U.S. economy under Trump was strong: unemployment hit a 50-year low of 3.5%, and GDP growth in 2018 was the highest since 2005. Over the full term including 2020, average GDP growth was about 2.6% (though that masks the deep 2020 contraction and partial rebound) nasdaq.com. Inflation during 2017–2019 was subdued ~2% or less, and for Trump’s term overall averaged just 1.4% (thanks in part to the 2020 deflationary shock) nasdaq.com. Notably, that 1.4% figure is the second-lowest inflation of any presidency since WWII nasdaq.com. Low inflation and decent growth usually bolster a currency’s value. Meanwhile India’s inflation ranged from 3% to 6% in those years, so the inflation gap wasn’t as wide as before – which could be one reason the rupee’s depreciation was relatively modest in this period (aside from episodic drops). The Federal Reserve was a key player: its tightening cycle in 2018 made the dollar attractive (INR fell), and its easing in 2020 provided relief. From a political perspective, one might expect a Republican administration’s tighter monetary leanings to strengthen the dollar, but in Trump’s case, he actually pressured the Fed to ease. Still, the net effect was a continued strong dollar until the very end of his term. By 2021, the dollar index had come slightly off its highs, but against INR it was near historic highs. Overall, under Trump, the USD remained robust and the INR hit record lows – consistent with the long-run trend rather than a departure. There isn’t clear evidence that Trump’s party affiliation alone drove this; his tax cuts did boost the dollar in 2018, but his trade policies had mixed effects. The COVID shock was a major wildcard that again shows non-partisan factors dominate: a global crisis can strengthen the USD (flight to safety) and weaken emerging market currencies regardless of who is president.
Joe Biden Administration (2021–Present)
USD/INR Trend: Joe Biden took office in January 2021 with $1 ≈ ₹73.9 fred.stlouisfed.org. By early 2023, the rate hovered around ₹82–₹83 per USDfred.stlouisfed.org, and in 2024 it has been in the ₹82–₹85 range forbesindia.com. The rupee hit an all-time low around ₹83.2 per USD in late 2022. In percentage terms, the INR has lost roughly 11–12% of its value vs the dollar in Biden’s first three years. The most notable movement came in 2022, when the U.S. dollar soared against nearly all currencies. In fact, the dollar index gained about 13.5% in 2022 – reaching parity with the euro and multi-decade highs against yen and pound atlanticcouncil.org – as the U.S. Federal Reserve hiked interest rates at the fastest pace in decades to combat inflation. This global dollar strength hit the rupee as well, pushing it above ₹80. By mid-2023, as U.S. inflation started cooling and the Fed slowed rate increases, the dollar’s rise leveled off and the INR stabilized in the low 80s. Still, the USD/INR under Biden has been consistently higher than ever before, indicating a stronger USD/weaker INR on average. It’s worth noting that the rupee’s depreciation in this period is not extreme by historical standards (roughly 4% per year, which is close to the inflation differential between India and the U.S.). So, while the dollar under the Democratic Biden administration has been very strong, much of that is due to cyclical forces (post-pandemic inflation and Fed policy) rather than partisan ideology.
Economic Policies: Biden’s administration came in with an aggressive fiscal stimulus agenda. In early 2021, the American Rescue Plan – a $1.9 trillion stimulus – was enacted, followed by large infrastructure and industrial policy bills. This fiscal push, along with reopening from the pandemic, led to a surge in U.S. demand and growth in 2021 (real GDP grew 5.7% in 2021). It also coincided with a spike in inflation to 40-year highs by 2022 (peaking around 9% CPI in mid-2022). High inflation eroded Americans’ purchasing power and prompted the Federal Reserve to embark on rapid monetary tightening. In 2022, the Fed raised interest rates from near 0% to over 4% within the year – a pace reminiscent of early 1980s. Higher U.S. rates attracted capital from around the world back into dollar assets, significantly lifting the dollar’s exchange value atlanticcouncil.org. Meanwhile, Biden’s fiscal policies (while boosting short-term growth) also led to a higher trade deficit – the U.S. trade gap hit a record $1 trillion in 2021 as stimulus-fueled Americans bought imported goods in droves. A large trade deficit tends to weaken a currency by increasing supply of that currency abroad, but in the U.S. case, the effect was offset by capital inflows (foreigners investing in the booming U.S. economy and chasing higher interest rates). The Biden administration has generally maintained the traditional stance of not intervening in the dollar’s value, even as it reached multi-decade highs. In fact, 2022 saw some international concern about the strong USD (echoing Plaza Accord discussions), but U.S. Treasury stayed committed to market-determined exchange rates. For India, the shock of 2022 meant the RBI had to use reserves to defend the rupee from excessive fall – it spent tens of billions of dollars to manage the INR’s decline. Indian inflation was also elevated (peaking ~7%), though lower than U.S. inflation at one point – an unusual situation. By late 2022, as global commodity prices eased, India’s position improved slightly, but the interest rate gap (U.S. rates rose above India’s repo rate) continued to favor the dollar.
Key Indicators: The U.S. under Biden so far (2021–2023) has seen strong growth (averaging about 3.2% annual GDP growth, although that includes the initial rebound from the pandemic) nasdaq.com and a rapid fall in unemployment to ~3.4%, one of the lowest on record nasdaq.com. However, inflation has averaged about 5% (including the 2022 spike) nasdaq.com, which is the highest inflation since the early 1980s. This mix – high inflation prompting high interest rates – is a classic recipe for a stronger dollar in the short run (much like early Reagan years). Indeed, the parallel has been noted by economists: the dollar’s surge in 2022 had echoes of its 1980s surge atlanticcouncil.org. For the rupee, India’s own fundamentals were relatively stable (growth bounced back from a contraction in 2020, and external deficits, while widened, were financed). The fact that the rupee only fell ~10-12% in such a strong-dollar storm suggests the RBI’s active management and India’s decent performance limited the damage. Still, the USD/INR reaching ~₹83–85 forbesindia.com is symbolic – it shows the USD at its strongest against INR ever. As of the latest data, there are signs U.S. inflation is moderating and the Fed may pause hikes, which could cap further dollar gains. Whether the rupee strengthens back meaningfully remains to be seen; past episodes show that rupee depreciation tends to be sticky. In terms of political correlation, one might note ironically that Democrat Biden’s term has had one of the strongest dollars in decades, contradicting any simple notion that Republican presidencies mean strong USD and Democratic mean weak USD. The reality is that the Fed’s anti-inflation stance and global risk sentiment have been far more decisive.
Conclusion: Does Party Matter for USD/INR?
Analyzing four decades of data, it’s clear that the USD/INR exchange rate has largely followed a downward (INR weakening) trajectory regardless of U.S. president or party. Major inflection points in the exchange rate were usually caused by macroeconomic events and policies that transcended party lines: the Volcker shock and Plaza Accord in the 1980s (strong USD) atlanticcouncil.org, India’s 1991 crisis (rupee devaluation) forbesindia.com, the late-90s tech boom (strong USD) and Asian crisis, the 2000s twin deficits and 2008 crash (USD swings), the 2013 taper tantrum (USD up, INR down) reuters.com, and the 2022 rate-hike cycle (USD surge) atlanticcouncil.org. If one calculates the rupee’s percentage decline under Republican vs. Democratic presidents, the differences are not consistently one-sided. For instance, the rupee’s steepest drop in one term occurred under Republican George H.W. Bush, but that was due to Indian policy changes. The rupee also weakened significantly under Democrats like Obama (about 35%) and Biden (~10% in first half term). Meanwhile, it was roughly flat under Republican George W. Bush (because of opposite moves canceling out). Academic research does suggest that generally, Republican administrations favor tighter monetary/fiscal stances which could appreciate the dollar, whereas Democrats’ expansionary policies might depreciate it walton.uark.edu. However, in practice, each administration faced unique conditions. For example, Clinton (a Democrat) presided over a strong dollar era thanks to tech-driven growth and fiscal surpluses, while George W. Bush (a Republican) saw a weaker dollar mid-term due to large deficits and easy money. The correlation between party and USD strength is thus not ironclad in the USD/INR case – external factors and each country’s economic situation were more determinative.
Major Influences by Administration: Under Reagan and Bush Sr. (1980s), the dollar was strong initially and the rupee’s fall was driven by anti-inflation policies and India’s adjustments. Clinton’s 1990s saw stability and moderate INR decline amid U.S. prosperity and Indian reforms. The Bush Jr. 2000s showed a dollar dip (benefiting INR) then a spike – aligning with U.S. deficit cycles and crisis dynamics rather than partisan ideology. Obama’s years reaffirmed that Fed policy shifts (QE and taper) greatly sway the USD/INR. Trump’s term, despite nationalist rhetoric, did not fundamentally alter the dollar’s long-run path, and Biden’s term so far has been dominated by post-pandemic economics.
Key Economic Indicators: Examining inflation, growth, and trade in each period reinforces these conclusions. U.S. inflation was brought to heel under Reagan (helping strengthen the dollar) reaganfoundation.org, remained moderate through most presidencies (boosting dollar credibility), and spiked under Biden (leading to aggressive Fed action that strengthened the dollar anyway). U.S. GDP growth tended to be higher under Democrats on average (Clinton, Obama’s recovery, Biden’s rebound) and lower during some Republican terms (Bush Sr.’s recession, Bush Jr.’s crisis) nasdaq.com – which is somewhat paradoxical for currency impact, since stronger growth often strengthens a currency, yet the dollar did not consistently follow that because of policy responses (e.g. strong growth under Biden came with high inflation, eliciting rate hikes that did boost the dollar). Trade balances started deteriorating in the Reagan era and saw record deficits under Bush Jr., yet the dollar remained the world’s primary reserve currency, and these deficits were financed by capital inflows paulkrugman.substack.com wita.org. India’s own growth and inflation generally outpaced America’s, which structurally pressures the INR downward over time forbesindia.com.
In conclusion, the strength of the USD against the INR has not shown a consistent partisan bias; instead, each administration’s particular economic context and policy mix played a role. Both Republican and Democratic presidents have overseen periods of dollar strength and relative weakness. What stands out is that the rupee’s decline versus the dollar has been a long-run trend driven largely by higher Indian inflation and periodic global shocks. U.S. policies certainly influenced short-to-medium term moves – for example, Reagan’s tight money vs. Trump’s trade war vs. Biden’s stimulus – but these effects often coincided with or were counteracted by other factors (Fed actions, crises). The data and history suggest that global macroeconomics trump partisan politics in determining the USD/INR path. The U.S. dollar remains strong when the U.S. economy and interest rates are strong relative to the world, irrespective of president. As such, investors and analysts should be cautious about linking currency strength solely to the party in power, and instead consider the broader economic policies and conditions that each administration faces. The USD/INR story from 1985 to 2025 is one of an overall weakening rupee, punctuated by episodes that often align more with central bank policy and economic cycles than with red or blue administrations.
Sources: Historical exchange rates from RBI/Federal Reserve fred.stlouisfed.org; U.S. economic indicators from Nasdaq/GOBankingRates nasdaq.com; policy analysis from news and research reaganfoundation.org reuters.com